
🎓 Master's Thesis
Graduate project for a Master's degree in Data Analysis!


I have root access..

I think in tables, I dream in charts.
💻 O mnie
Project author, data analyst, and Shiny application developer (and more 😊)
Student of Data Analysis (WSB-NLU), class of 2023-2025
Specializes in data exploration, ETL processing, interactive visualizations, and forecasting models (regressions, ARIMA)
Passionate about new technologies, AI, open data, and projects with social impact
Technologies: R, Shiny, dplyr, plotly, leaflet, ARIMA, ETL, AWS S3
📊 O mnie
Project author, data analyst, and market trend researcher
Student of Data Analysis (WSB-NLU), class of 2023–2025
Specializes in data preparation, descriptive and predictive analysis, and creating synthetic business insights
Focused on the social aspects of data analytics, including the impact of mobility on quality of life
Technologies: R, dplyr, ggplot2, plotly, tidyr, Shiny

Dr. Katarzyna Jermakowicz
🎓 Master's Thesis Supervisor
Assistant Professor – Faculty of Social Sciences and Informatics, WSB-NLU
Specialization: applied mathematics, statistics and data analysis, predictive modeling and business intelligence visualization.
📥 Download Master's Thesis
Click the button to download the full version of the Master's thesis in PDF format.
Download PDFThe chart presents the number of new passenger vehicle registrations in Ukraine in the years 2017–2023.
📈 Between 2017–2021, this number remained in the range of 161–205 thousand, with the highest value in 2021.
📊 This trend reflects the growing interest in brand-new vehicles — among both individual and fleet customers.
📉 After 2022, there was a drastic decline: only 2,819 registrations in 2022 and 3,902 in 2023.
⚠️ This results from the war crisis, supply chain disruptions, lack of availability, and shifting buyer priorities.
🎯 The value of this indicator allows for the analysis of not only the car market but also consumer sentiment and the country's economic condition.
* Source: data from Ukraine's public registries data.gov.ua
The chart presents the number of used vehicle registrations in Ukraine in the years 2017–2023.
📈 From 2017 to 2021, the number of registrations grew systematically – from 1.306 million to a record 2.213 million.
🔁 The data shows high interest in vehicles from the secondary market and well-developed imports from EU countries.
📉 After February 2022, a collapse occurred – in 2022 and 2023, 64,349 and 57,483 vehicles were registered, respectively.
⚠️ The reasons include the war, logistical chaos, simplified procedures, and the lack of traditional registration for humanitarian transport.
🎯 This chart allows for the assessment of the scale of secondary market regression and the challenges for mobility and safety policy in the coming years.
* Source: data from Ukraine's public registries data.gov.ua
The chart presents registrations of new and used vehicles and their total sum in the years 2017–2023.
🔵 New vehicles represented the minority, reaching a peak of 205,838 units in 2021.
🔴 Used vehicles dominated the market, with a record number of over 2.213 million registrations annually.
🟢 In 2021, the highest total number of registrations was recorded: 2,419,673.
📉 In the years 2022–2023, there was a dramatic market collapse — the number of registrations dropped by over 97%.
🎯 The chart reflects the impact of the war on mobility and serves as an important indicator of the automotive market's health in Ukraine.
* Source: data from Ukraine's public registries data.gov.ua
The chart presents the annual number of vehicle registrations broken down by owner type: Private and Other in the years 2017–2023.
🟩 Private owners constituted the vast majority — in 2021, their number of registrations exceeded 2.2 million.
🟥 Other owners (companies, institutions) maintained a stable share until 2021, when a noticeable increase was recorded.
📉 After 2021, there was a sharp drop in registrations in both groups, which is a direct result of the war and administrative restrictions.
🎯 This breakdown allows for an analysis of the market structure and the role of the private and institutional sectors in Ukrainian mobility.
* Source: data from Ukraine's public registries data.gov.ua
The chart presents the five most frequently chosen car body colors registered in Ukraine in the years 2017–2023.
⬛ Gray dominates throughout the period — in 2021, it reached a record level of over 713 thousand registrations.
⬜ White and 🖤 black colors maintain high popularity, remaining in the top tier.
🔵 Blue and 🔴 red enjoy moderate interest — the latter with a clear downward trend.
📉 Since 2022, the number of vehicle registrations in every color has dropped dramatically, which is related to the outbreak of war and the logistics crisis.
🎯 Vehicle color reflects aesthetic preferences of consumers, but also practical, cultural, and economic conditions.
* Source: data from Ukraine's public registries data.gov.ua
The chart above presents the three most frequently registered vehicle brands in Ukraine for each year in the 2017–2023 period.
🔝 Among the leaders are brands such as Volkswagen, Renault, VAZ (Lada), and Mercedes-Benz, which appeared most frequently in the annual rankings. In individual years, we can observe shifts in dominance — particularly notable is the systematic growth of Volkswagen's share, which in 2021 reached a record level of over 270 thousand registrations.
📉 In the years 2022–2023, there was a sharp drop in the number of registrations for all brands — directly related to the war and the difficult logistical and economic situation.
📌 An interesting fact is that the VAZ brand, despite a general decline in popularity in Europe, remained at the top of the Ukrainian market until 2021.
🧠 This chart perfectly shows how dynamically the structure of consumer preferences in the automotive sector can change — under the influence of economic factors, car availability, and geopolitical events.
* Source: data from Ukraine's public registries data.gov.ua
The chart above presents the dynamics of medical vehicle registrations (ambulances) in Ukraine for the years 2017–2023.
🔹 In the years 2017–2021, a systematic increase in the number of registrations was observed — from 1,430 in 2017 to a record 3,668 in 2021. This was the result of fleet modernization, implementation of government programs, and increased demand for modern medical transport.
❗ Since 2022, there has been a sharp drop in registrations — only 67 ambulances in 2022 and 98 in 2023. This phenomenon is directly related to the outbreak of full-scale war, which led to the suspension of administrative processes, loss and mobilization of vehicles, and prioritization of other state tasks.
📝 The drop in registrations over the last two years is not the result of natural market trends, but a direct consequence of the war situation. When analyzing this data, one must consider the geopolitical context and the specifics of crisis conditions.
In the years 2022–2023, over 173,000 vehicles were imported to Ukraine as humanitarian aid — including ambulances and military vehicles.
🔹 Large-scale imports were possible thanks to simplified customs procedures and the war situation, which required immediate transport support.
❗ It is worth noting that a significant portion of these vehicles was not formally registered in traditional police databases — due to simplified procedures, the nature of humanitarian aid, and difficult war conditions.
📝 Simultaneously, an increase in the number of import violations was recorded, which may be an effect of the fast pace and high volume of transactions under exceptional circumstances.
* Source: data from Ukraine's public registries data.gov.ua
The chart above shows the annual number of registrations for the main types of vehicles in Ukraine in the years 2017–2023. The data is divided according to vehicle categories: passenger cars, trucks, buses, trailers, and semi-trailers.
📊 Passenger cars dominate every year, accounting for the largest percentage of all registrations. There is a clear increase in numbers until 2021, when a peak level of over 2 million vehicles was reached.
⚠️ The decline after 2021 is radical and clearly linked to the outbreak of war in February 2022. Registrations of all vehicle types dropped drastically – especially noticeable for buses, semi-trailers, and trucks.
🔍 In the years 2022–2023, we see symbolic registration numbers, which may result from:
- administrative restrictions,
- difficulties with traditional registration of humanitarian vehicles,
- lack of consistent data during the war period.
🎯 The goal of this visualization is to capture the dynamics of the transport market in Ukraine in a geopolitical and economic context.
* Source: data from Ukraine's public registries data.gov.ua
The chart shows the number of motorcycle and scooter registrations in Ukraine in the years 2017–2023.
📈 Motorcycles gained popularity until 2021, reaching a record level of over 70,000 registrations.
🛴 Scooters, although present on the market, did not reach such high values — in their best years, they fluctuated around 13–14 thousand.
⚠️ In the years 2022–2023, the number of registrations dropped nearly to zero — especially dramatically in the case of scooters. This may be a consequence of the war, import restrictions, and the market shifting to other means of transport.
🎯 This data can serve as a basis for analyzing the future of light mobility and the role of two-wheelers during a crisis.
* Source: data from Ukraine's public registries data.gov.ua
The chart presents how the average age of vehicles registered in Ukraine changed in the years 2017–2023.
📈 In the years 2017–2019, the average age gradually increased, reaching a level above 12 years. However, in 2020, there was a sudden drop, likely caused by the increased import of younger vehicles after the pandemic period.
⚠️ Since 2021, we have observed a systematic increase in age, reaching over 13 years in 2023. This increase may be a result of the deteriorating economic situation, the lack of new cars on the market, and the import of older used vehicles.
🎯 The colors of the points on the chart reflect the average age value – from dark purple (younger cars) to bright yellow (older vehicles).
📌 The rising age of vehicles affects road safety, the environment, and fleet maintenance costs. It also indicates the need for corrective actions in transport policy and infrastructure.
* Source: data from Ukraine's public registries data.gov.ua
The chart above presents the five most frequently registered passenger car body types in Ukraine in the years 2017–2023.
🔷 Sedans and 🟧 station wagons maintain a dominant position throughout the period, with a record for station wagon registrations in 2021 – over 920,000.
🟩 Hatchbacks rank third, with registrations ranging between 220,000–370,000 per year.
🔺 Passenger vehicles, cargo-passenger, and coupes appear sporadically and constitute a niche part of the market.
📉 The years 2022–2023 bring a drastic drop in registrations in every category — due to the war, limited imports, and logistical challenges.
🎯 This chart allows for the analysis of changing consumer preferences and provides knowledge about the car market structure in the context of variable economic and geopolitical conditions.
* Source: data from Ukraine's public registries data.gov.ua
The chart presents the number of vehicle registrations by fuel type in Ukraine in the years 2017–2023.
🟪 Gasoline and 🟦 diesel dominated throughout the analyzed period. In 2021, the number of gasoline vehicle registrations exceeded 1.1 million.
🟩 Gasoline with gas (LPG) remained a strong and economical alternative, with registrations reaching as high as 500,000 per year.
⚡ Electric vehicles and 🔴 hybrids gained importance between 2019–2021, though they still represent a small percentage of the total.
📉 The years 2022–2023 show a dramatic drop in the number of registrations across all fuel types — directly related to the war, the import crisis, and shifting transport priorities.
🎯 Analyzing changes in fuel structure helps understand mobility development directions and the market's readiness for energy transformation.
* Source: data from Ukraine's public registries data.gov.ua
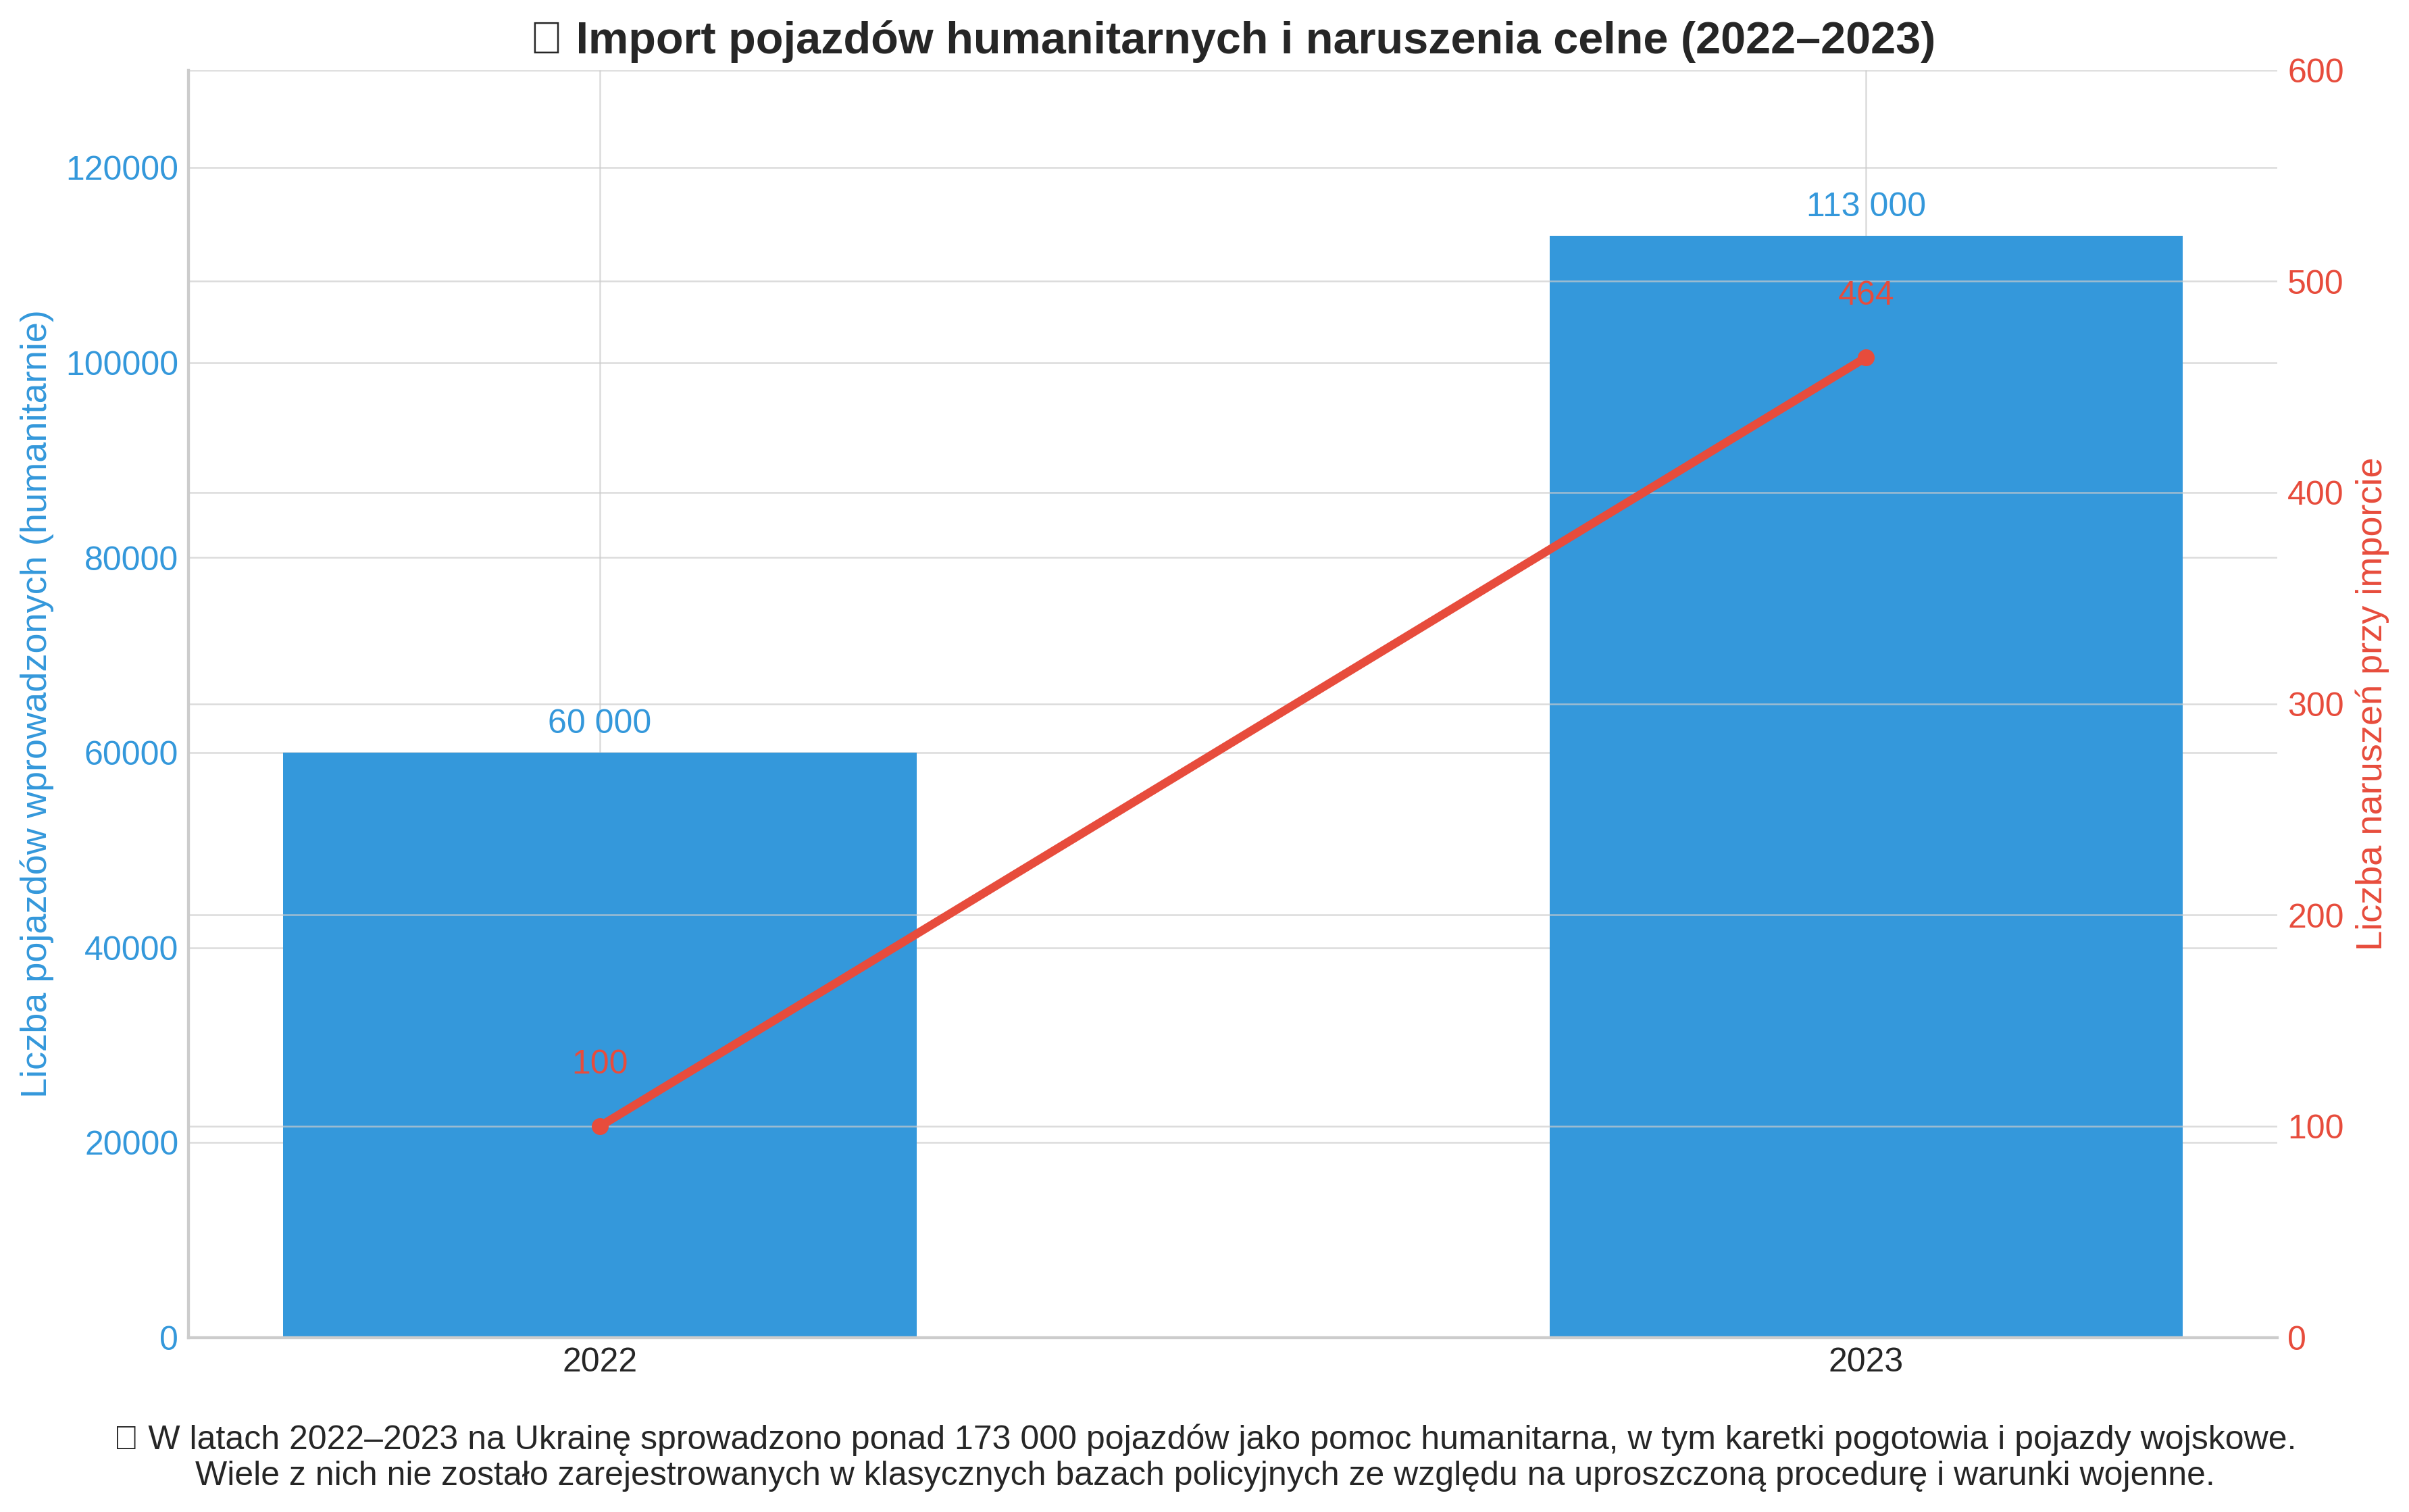
📦 In the years 2022–2023, over 173,000 vehicles were brought to Ukraine as humanitarian aid, including ambulances and military vehicles.
🔍 Many of them were not registered in traditional police databases due to simplified procedures and war conditions.
⚠️ The increase in the number of customs violations (from 100 to 464) shows that the procedures are not only used legally but also bypassed.
* Source: data from Ukraine's public registries customs.gov.ua
Linear Regression
🔎 The chart above presents a linear regression of the number of registered vehicles in Ukraine in the years 2017–2023. The trend line was calculated using the least squares method and is intended only to illustrate the general trend of changes over time.
❗ The linear regression model does not reflect actual market dynamics. The R² value of 0.327 means that the model explains only about 32.7% of the variance in the number of vehicle registrations during the studied period.
📉 The main reason for the poor model fit is the sharp drop in the number of registrations after February 2022, when the full-scale invasion of Ukraine began. Data from 2022–2023 is heavily distorted due to:
- ⚠️ interruptions in traditional registration processes,
- 🚐 a large number of humanitarian vehicles not included in the registries,
- 📊 organizational and operational changes in the registration systems.
🧠 For this reason, linear regression should not be treated as a predictive tool. It only provides a simplified visualization of the trend. For this type of data, it is appropriate to use more advanced methods, such as non-linear models, intervention models, or structural approaches that can account for the impact of sudden external events.
* R² – coefficient of determination
* Source: data from Ukraine's public registries – data.gov.ua
ARIMA Model
🔮 The chart above presents a forecast of the number of vehicle registrations in Ukraine for the years 2024–2025, developed based on the ARIMA (Autoregressive Integrated Moving Average) time series model.
📈 The model was trained on data from 2017–2023 and generated a forecast along with a 95% confidence interval, marked on the chart with a red band. The model result indicates a stabilization of the number of registrations at approximately 1,369,240 vehicles annually.
❗ However, actual data for 2024 shows a much higher value — over 2,300,000 registrations. This means that the ARIMA model significantly underestimated the actual situation. This is due to the fact that traditional time series models are unable to account for sudden and extreme disruptions resulting from the war and changes in the functioning of registration systems.
📉 Therefore, ARIMA results should be interpreted with great caution. Models of this type perform well in a stable environment, whereas in conditions of irregularity, administrative interruptions, and a large number of humanitarian vehicles — their accuracy drops significantly.
* The confidence interval indicates the range in which the future value is expected to fall with 95% probability.
* Source: data from Ukraine's public registries – data.gov.ua
📊 2024 Registration Share
📘 Analytical Commentary
📊 In this chart, we want to draw attention not so much to the owner structure, but primarily to the extraordinary number of vehicle registrations in 2024 – as many as 2,344,544 vehicles.
📉 This is a value that completely shattered earlier forecasts – both those based on linear regression and predictive models like ARIMA. In recent years, the market showed a clear downward trend, which is why none of the classic statistical methods predicted such a rapid surge.
🛃 The key factor in this situation was the decision by Ukrainian authorities to temporarily abolish customs duties and taxes on vehicle imports. This change led to a massive influx of vehicles from abroad, as both private individuals and companies sought to take advantage of the window of opportunity before fees were potentially reinstated.
📈 As a result of this phenomenon, we observe an unprecedented increase in the number of registrations, which also affects other sectors of the economy:
- revenues for insurance companies are increasing,
- demand for service and repairs is growing,
- fuel and oil consumption is rising,
- the spare parts market is expanding,
- pressure on road and service infrastructure is increasing.
🧠 This example shows that government decisions can radically change the market landscape, and future analytical models should also account for legislative, crisis, and geopolitical factors that influence consumer behavior and market structure.
⚠️ Conclusion: forecasting requires context – geopolitics, law, and social changes must be part of the analysis, not just numerical data.
* Source: data from Ukraine's public registries data.gov.ua (2024)
Note regarding data quality after 2022
During in-depth analysis and validation using machine learning models (gradient boosting), it was revealed that after 2022, the Ministry of Transport of Ukraine introduced changes to the registry structure and the naming of registration operations ('OPER_NAME' field). This change caused some records to stop being correctly classified according to the previous division into new and used vehicles.
Gradient boosting models also pointed to an unnatural trend collapse in 2022–2023 and clear inconsistencies between the wartime data structure and data from the earlier period. These findings led to an additional data quality audit and an update of the vehicle classification methodology.
Currently, classification is based on a more stable and objective criterion — comparing the vehicle's year of production with its registration year. The total number of registrations, however, is calculated solely based on the registration date ('D_REG'), which eliminates the risk of errors resulting from changes in the 'OPER_NAME' structure.
Conclusion: all analyses regarding the 2022–2025 period should be interpreted taking into account the described limitations and disruptions related to the ongoing war.
📘 Technical Description of the Master's Thesis
📊 Technical Description of the Analytical Project
The Master's project, conducted within the Data Analysis (WSB-NLU, 2025) program, focuses on the exploration of the Ukrainian automotive market in the years 2017–2023, using modern statistical and visualization tools in the R language and Shiny environment.
📂 Data Sources and Preparation
- Acquired 7 large data files in
CSVandBSVformats. - Created a multidimensional data matrix (~5 GB) covering information on vehicle types, colors, fuel, owners, locations, etc.
- Implemented a full data cleaning and integration process using
dplyr,tidyr,lubridate,janitor, and other packages.
⚙️ ETL and Data Optimization
- Implemented the ETL (Extract – Transform – Load) process, converting data into an optimized structure.
- Data was initially saved as
.fst, reducing size from 5 GB to approximately 1 GB. - Ultimately, the
.rdsformat was used for full compatibility with theShinyapplication.
📈 Analysis and Modeling
- Conducted correlation analyses for temporal and categorical variables.
- Built linear regressions for key indicators (registrations vs. years).
- Utilized ARIMA models for forecasting registrations in 2024–2025.
- Created interactive visualizations using
plotlyandleaflet.
🚀 DevOps & Deployment
- The project utilizes containerization with Docker to ensure a reproducible runtime environment and fast deployment across various servers.
- Automation of deployments and tests achieved via GitHub Actions (CI/CD), allowing for seamless updates and continuous code integration.
- The dashboard is hosted on Hetzner cloud with SSL security, reverse-proxy via
Nginx, and concurrent multi-user support. - The project employs AWS S3 for secure file storage and Imgix for dynamic image processing and optimization.
- Source code and technical documentation are managed in a private GitHub repository.
💡 Conclusions
Through the application of R and Shiny, the project team created a fully interactive dashboard supporting the exploration of Ukrainian automotive market data. The project combines advanced data processing, modeling, and a modern UI, demonstrating the practical application of analytics in the context of real economic and social phenomena.
Project developed by: Anna Nenasheva & Maksym Nenashev